


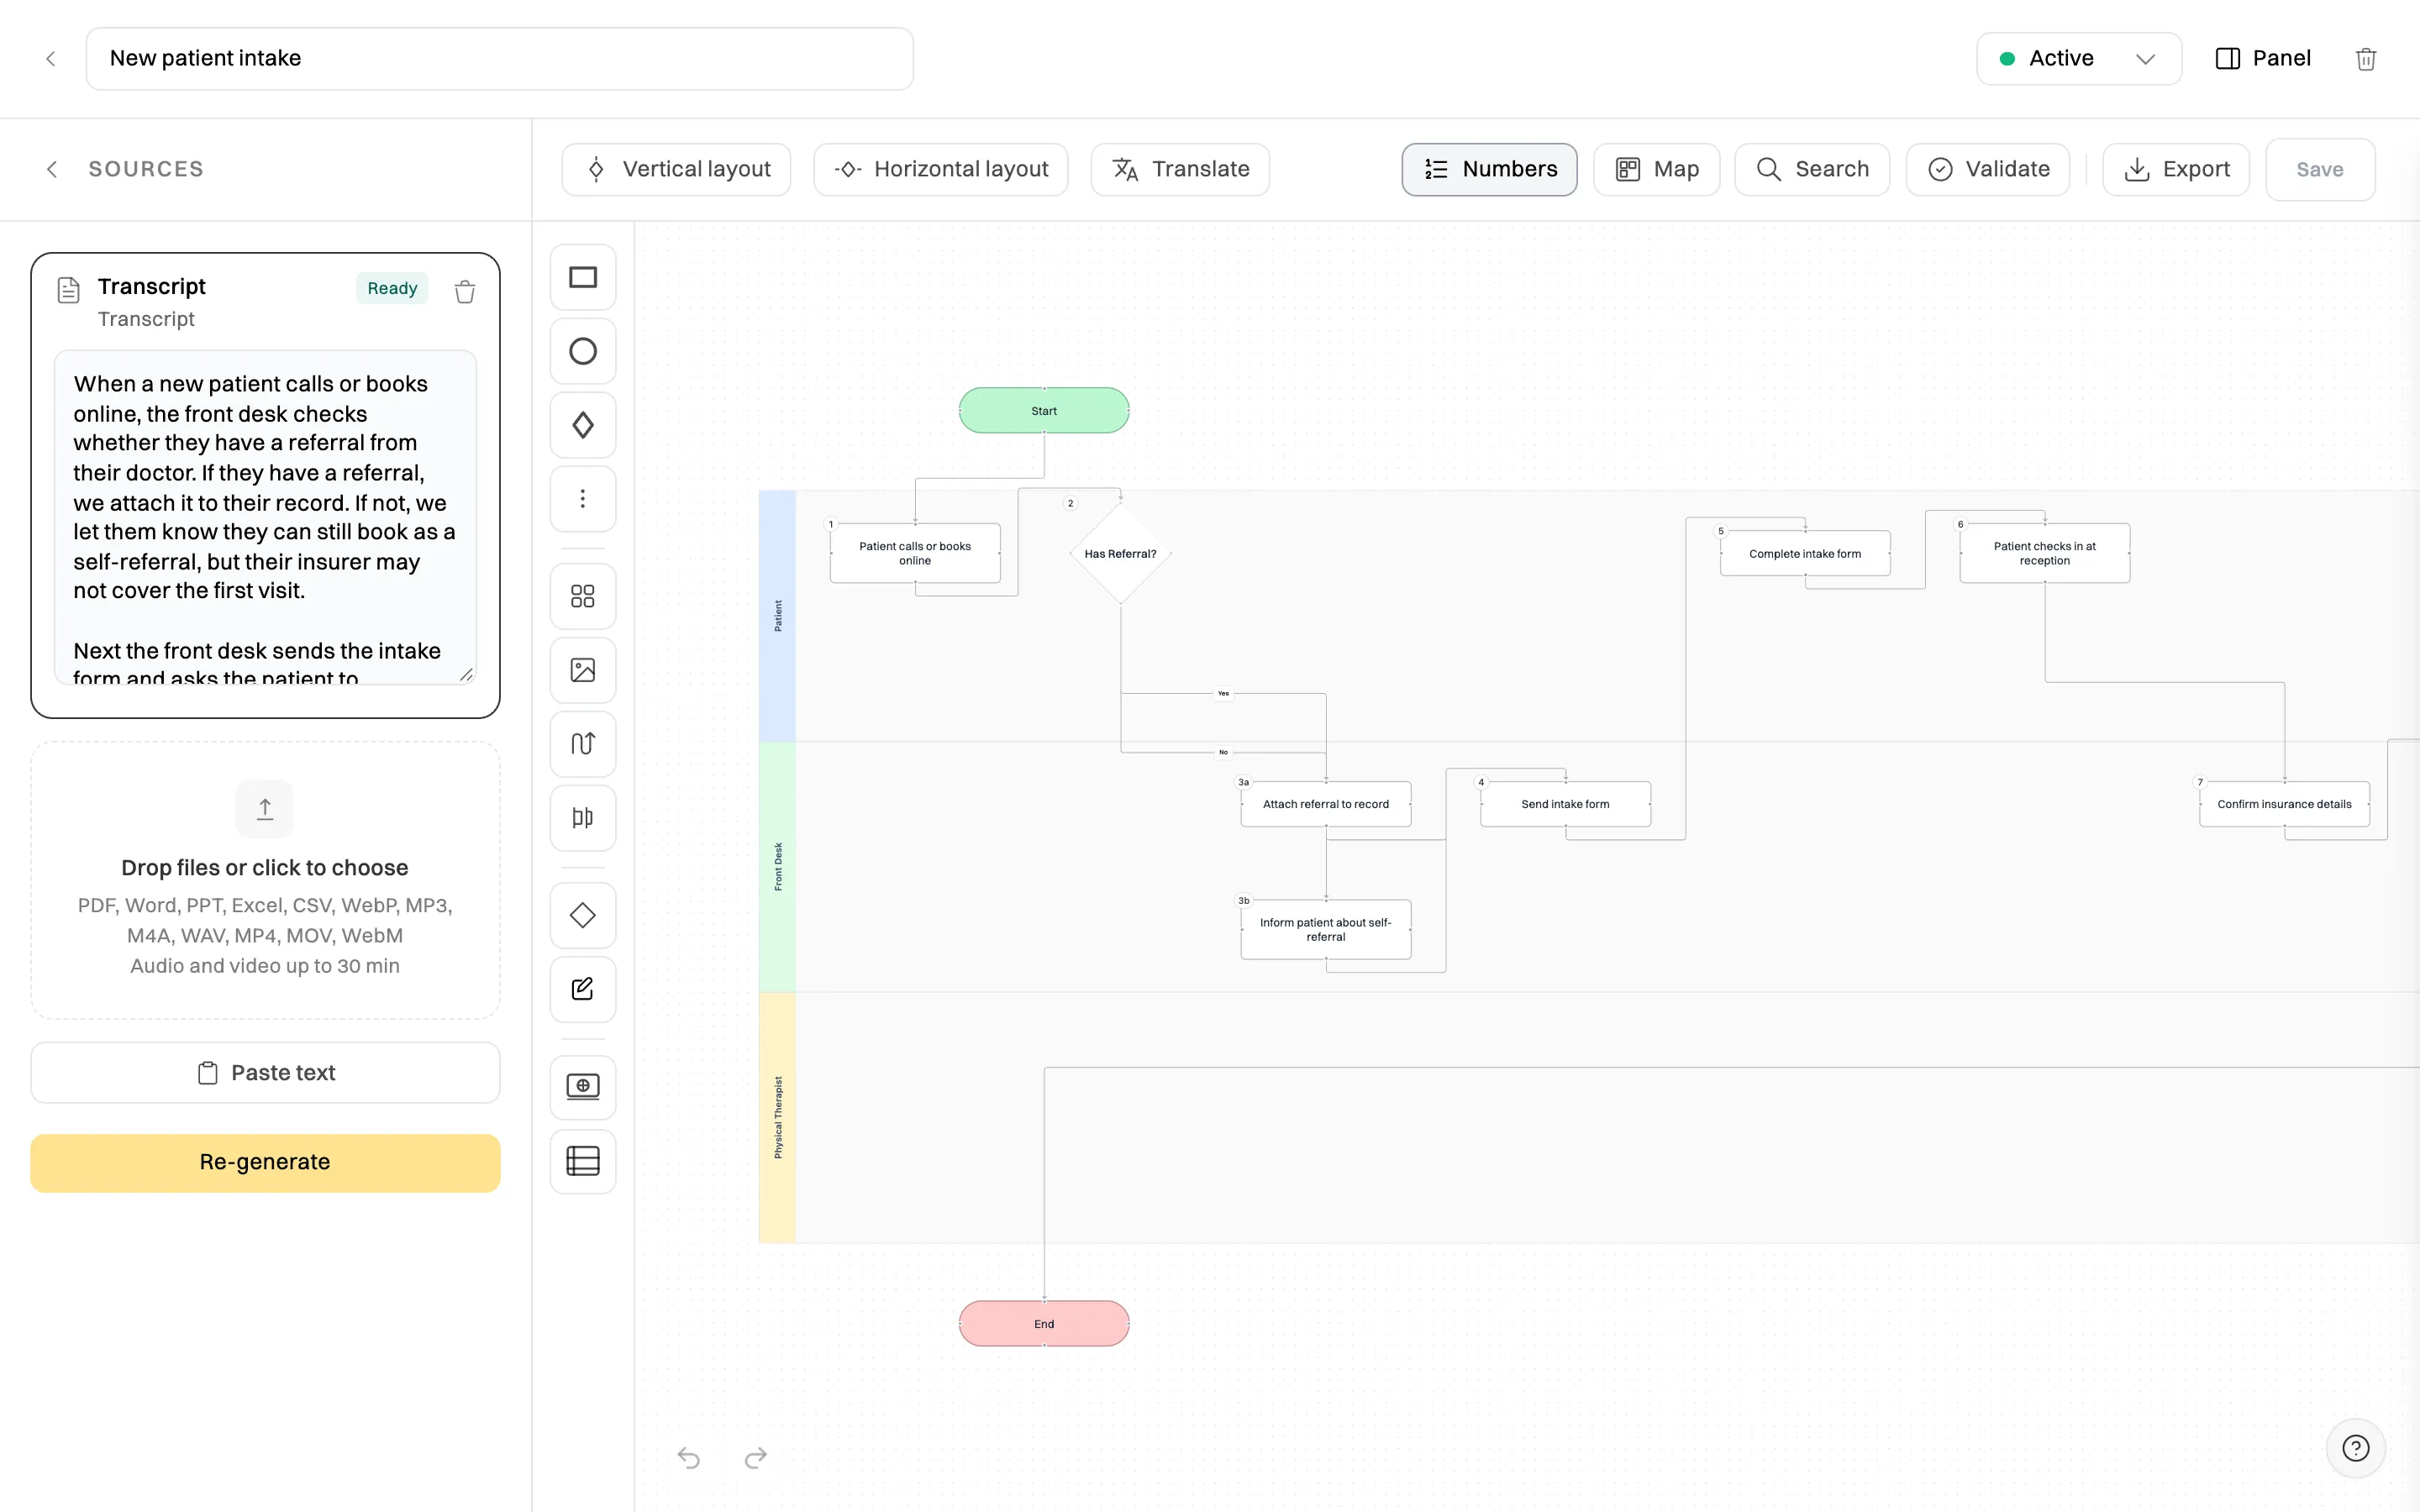
A process map is a picture of how a piece of work gets done. It starts with the event that sets the work off, such as a customer asking for a refund, and follows every step to the end, when the customer has their money back. Boxes show the steps, arrows show the order, diamonds show the decisions, and horizontal bands (swimlanes) show who does each step.
The point of drawing it is that a process you can see is a process you can agree on, teach and improve. Written down as a paragraph, “refunds go through customer service and sometimes the manager” hides all the questions that matter. Drawn as a map, it can’t: who checks the order, what happens when there’s no receipt, what the manager’s approval limit is, and how the customer is told.
A good process map answers five questions at a glance:
| Question | Where you see it on the map |
|---|---|
| What starts the process, and what ends it? | The start and end shapes |
| What happens, in what order? | The steps and the arrows between them |
| Where does the path split? | The decision diamonds and their labelled branches (Yes, No, Over $200…) |
| Who does each step? | The swimlane each step sits in |
| Where does work change hands? | Every arrow that crosses from one lane into another |
Process maps go by several names: process flowcharts, process flow diagrams, workflow diagrams, swimlane diagrams and business process models. They differ in detail, but each is a diagram of a process from trigger to outcome.
Process maps are older than computers. In 1921, the industrial engineers Frank and Lillian Gilbreth presented a paper to the American Society of Mechanical Engineers (ASME) called “Process Charts: First Steps in Finding the One Best Way to Do Work”. Their flow process chart used a small set of symbols to record each operation, movement, inspection and delay in a job, so that wasted effort became visible. In 1947, ASME adopted a symbol set based on the Gilbreths’ work as its standard for process charts.
Three later ideas shaped the maps businesses draw today:
You don’t need to know any of this to draw a useful map. But it explains why the same shapes keep appearing, and why the best maps focus on handoffs and decisions rather than just listing tasks.
People use these words loosely, and it causes confusion when a team is deciding what to write. The short version:
| What it is | Best for | Example | |
|---|---|---|---|
| Flowchart | Any diagram of steps and decisions in order | Simple logic with one person or system | “Is the item faulty? Yes: replace. No: check the returns window.” |
| Process map | A flowchart of a business process, usually with swimlanes for roles, and often owners, times and linked documents | Work that crosses people or teams | The refund process across customer service, the warehouse and the manager |
| SOP | Written, numbered instructions for doing one procedure | Teaching someone exactly how to do a step | “How to issue a refund in Shopify”, with a screenshot for each step |
Every process map is a kind of flowchart, but not every flowchart is a process map. And a map and an SOP aren’t rivals: the map shows the whole journey and who owns each stage, and the SOP gives the detail behind a step. Our guide to SOPs vs work instructions vs process maps explains how to layer them, and what is a standard operating procedure covers the written side.
Most process maps use a handful of shapes. The basic flowchart shapes have been used for decades (they were standardised in ISO 5807 in 1985), and BPMN uses close equivalents with a few extra details.
| Shape | Basic flowchart meaning | BPMN equivalent |
|---|---|---|
| Oval or rounded rectangle | Start or end of the process | Start event (thin circle) and end event (thick circle) |
| Rectangle | A step or task, written as a verb: “Check the order” | Task (rounded rectangle) |
| Diamond | A decision, with a labelled arrow for each answer | Gateway (diamond), exclusive when only one path is taken |
| Arrow | The flow from one step to the next | Sequence flow (solid arrow) |
| Parallelogram or document shape | An input or output, such as a form, invoice or report | Data object (page with a folded corner) |
| Horizontal band | A role or team that does the steps in it | Lane, inside a pool for the whole organisation |
| Rectangle with a plus sign | A step with its own detailed map underneath | Collapsed sub-process |
Three rules keep a map readable, whatever notation you use. Write each step as a verb and an object (“Send the quote”, not “Quote”). Label every branch out of a decision. And make sure every path ends somewhere: a step with no arrow out is a gap in the process, not a finished map.
There’s no single correct kind of process map. Choose the type by the question you’re trying to answer.
| Type | What it shows | Use it when |
|---|---|---|
| High-level map (SIPOC) | Suppliers, Inputs, Process (in five to seven big steps), Outputs and Customers | You need to agree the scope of a process before mapping it in detail |
| Basic flowchart | Steps and decisions in order, without roles | One person does the whole process, or you’re mapping logic such as eligibility rules |
| Swimlane map | Steps arranged in a lane for each role, team or system | The process crosses people or departments, which is most business processes |
| Detailed process map | Every step and exception, often with owners, durations, systems and linked SOPs | You’re training people, automating the process or preparing for an audit |
| Value stream map | Each stage with its time, waiting time and inventory, plus the information that triggers the work | You want to cut lead times and waste, especially in production or fulfilment |
| BPMN diagram | The process in standard BPMN notation, with events, gateways and message flows | The map will be shared with analysts or loaded into workflow software |
Larger organisations describe process maps by level, from a one-page overview of the whole business down to individual tasks. A common reference is the APQC Process Classification Framework, which uses five levels: category, process group, process, activity and task. For a small business, three levels are usually enough:
You’ll also hear about as-is and to-be maps. An as-is map shows how the process really runs today, workarounds and all. A to-be map shows how it should run after you’ve fixed it. Always draw the as-is map first, with the people who do the work. If you jump straight to the ideal version, you’ll design a process nobody recognises and miss the reasons the workarounds exist.
Here are three process maps that most small businesses need, described step by step. Each links to a free template you can open and edit.
A refund map is mostly decisions, so it’s a good first map to draw. Each question has a Yes and a No path, so every request is decided the same way, whoever handles it.
The map makes two things obvious that a paragraph wouldn’t: the approval limit (an arrow crossing into the manager’s lane) and the three different outcomes. Start from the refund eligibility flowchart template or the general yes/no flowchart template.
Onboarding fails at the handoffs: the laptop isn’t ready, nobody booked the induction, the contract wasn’t returned. A swimlane map shows each handoff as an arrow between lanes.
| Lane | Steps |
|---|---|
| Manager | Offer accepted (start) → confirm start date and role → plan the first week → meet the new hire on day one → 30-day check-in |
| HR or admin | Send the contract and forms → contract signed? (No: chase) → set up payroll and records |
| IT | Create accounts and email → prepare the laptop and access → confirm everything works on day one |
| New hire | Return the signed contract and forms → complete day-one induction → finish role training (end) |
Read across the lanes and you can see that IT can’t start until HR confirms the start date, and the manager’s first-week plan depends on IT. Those are the arrows to watch. The swimlane flowchart template gives you the layout, and the new hire onboarding checklist turns the steps into tasks with due dates.
For a trades or service business, quote to invoice is the process that makes the money. A detailed map adds owners, times and the documents each step produces.
Adding a time to each step shows where jobs wait. If quotes take a week to go out, that’s where you’re losing work. See the quote-to-invoice flowchart template and the variation approval flowchart template.
To agree how the work is done. Ask three people how a process runs and you’ll often get three answers. Mapping it together turns those versions into one, and that agreement is often worth more than the diagram.
To find the problems. Once a process is drawn, the trouble spots stand out: steps done twice, approvals nobody needs, handoffs with no owner, and decisions with no rule. Most process improvement starts with an as-is map.
To train people faster. A new starter who sees the whole journey understands why each step matters and where their work goes next. The map is the overview; the SOPs teach each step.
To delegate and remove key-person risk. A process that lives in one person’s head can’t be handed over. Mapping it is the first step to eliminating key-person dependency and learning how to delegate as a business owner.
To automate. You can’t automate a process you can’t describe. A clear map shows which steps are rules a system could follow and which need a person’s judgement.
To show auditors and buyers. Quality standards such as ISO 9001 take a process approach and expect you to understand how your processes interact. A set of current maps, linked to the procedures behind them, is good evidence. Buyers value it too: it shows the business runs on systems, not on its owner.
If you’d rather not start from a blank page, describe the process in plain words and let AI draw the first draft. Our step-by-step guide to creating flowcharts with AI shows how, and the free AI flowchart generator turns a description into a map in a minute.
| Mistake | Why it hurts | Do this instead |
|---|---|---|
| Mapping the ideal, not the reality | The map doesn’t match what people do, so they ignore it | Draw the as-is map first, then improve it |
| Too much on one map | Forty boxes and crossing lines nobody can follow | Keep a map to one process and roughly 5 to 25 steps; move the detail into sub-processes or SOPs |
| Vague step names | “Admin” or “Check” could mean anything | Use a verb and an object: “Check the delivery against the order” |
| Unlabelled decisions | Readers can’t tell which arrow is Yes | Label every branch, and write the rule (“Over $200?”) in the diamond |
| No lanes | Handoffs, the most common source of errors, stay hidden | Add a lane for each role whenever more than one person is involved |
| Drawn once, never updated | The process changes and the map quietly becomes wrong | Give each map an owner and a review date, and update it when the process changes |
| A map with no instructions behind it | People see what to do but not how | Link the SOP for each step that needs one |
You don’t need to start from scratch. These templates open in Wikidoc as editable process maps:
Browse them all in the flowchart templates library.
Wikidoc’s process mapping software draws a BPMN-style map for you from a plain-language description, a document or a recording, with a swimlane for each role and a labelled branch for every decision. Then you edit it like any diagram: give every step an owner, a time and its instructions, link the SOP behind it, and check the map for loose ends before you share it.
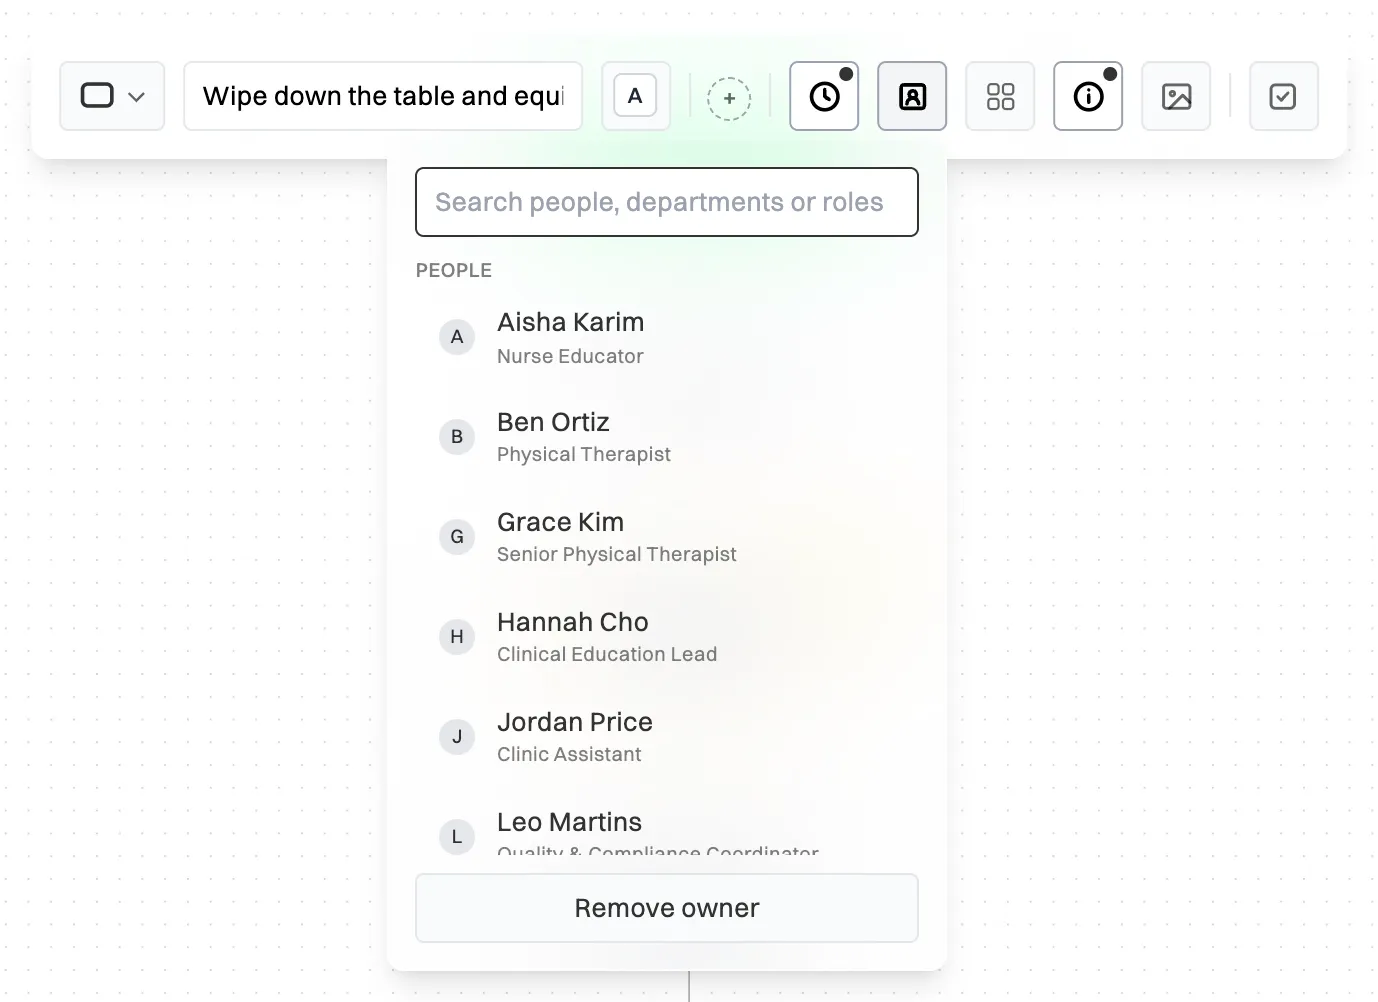
Maps export to PNG, SVG, PDF, Mermaid and JSON, and the PDF can add a table of every step with its owner, time and instructions, so the map doubles as a written procedure. The Free plan includes three process maps, plus ten made from templates, and the step-by-step Help Centre guide shows how to create a process map.
Start free and map the process your team asks about most.
A process map shows how work moves from start to finish, who does each step and where decisions and handoffs happen. Businesses use it to agree how a process should run, train new staff, find delays and duplicated work, and prepare a process for delegation, automation or an audit.
A flowchart is any diagram of steps and decisions in order. A process map is a flowchart of a business process, usually with a swimlane for each role and often with owners, times and linked documents. Every process map is a flowchart, but a simple flowchart doesn’t show who does the work.
The most common are high-level maps such as SIPOC, basic flowcharts, swimlane maps, detailed process maps, value stream maps and BPMN diagrams. Choose by the question you need answered: scope, sequence, who does what, full detail, waste and waiting time, or a standard notation for software.
A clear start and end, every step written as a verb, each decision with a labelled branch for every answer, and a lane for each role so handoffs are visible. Detailed maps add an owner and a time for each step, and links to the SOPs that explain how each step is done.
No. Simple boxes, diamonds, arrows and swimlanes are enough for most small business processes, and anyone can read them. BPMN is worth using when maps are shared with analysts or loaded into workflow software, because everyone reads its symbols the same way.


