


A flowchart is the fastest way to see how a process really works: every step, who does it, and where it branches. It’s also one of the most-skipped jobs in a small business, because drawing one by hand means dragging boxes, lining up arrows and redrawing half of it when you realise a step was missing.
With AI, you describe the process the way you’d explain it to a new starter, and the flowchart is drawn for you. This guide shows how to do it in Wikidoc, step by step, and how to turn the result into a process map your team actually uses.
A flowchart is a diagram of a process. Each step is a shape, arrows show the order they happen in, and decisions branch the flow depending on the answer. A handful of standard shapes keep flowcharts readable by anyone:
| Shape | Means |
|---|---|
| Rounded rectangle (oval) | Start or End of the process |
| Rectangle | A step or action, such as “Send the intake form” |
| Diamond | A decision, such as “Has a referral?”, with a labelled arrow for each answer |
| Parallelogram | An input or output, such as a form or report |
| Swimlane | A horizontal band for each role, so you see who does each step |
Flowcharts have been used since the 1920s because they make a process visible. Written instructions hide gaps; a diagram shows them. A step with no arrow out, a decision with only one answer, or a hand-off nobody owns becomes obvious the moment it’s drawn.
These terms are often used interchangeably, but they mean slightly different things:
| What it is | Answers | Example | |
|---|---|---|---|
| Flowchart | A diagram of steps and decisions in order | What happens, in what order? | The steps to approve a refund |
| Process map | A flowchart with more detail: swimlanes for each role, owners, durations, systems and linked documents | Who does what, in which system, and how long does it take? | The refund process across store, finance and manager, with owners and links to the SOP |
| Workflow | The process as it actually runs day to day, often automated or tracked in software, with tasks moving between people | Where is this case right now, and who’s next? | Each individual refund request moving through approval in your systems |
| SOP | Written step-by-step instructions for doing a task | How exactly do I do this step? | “How to process a refund in the POS”, with screenshots |
In short: a flowchart is the picture, a process map is the picture with accountability, a workflow is the process in motion, and an SOP is the instructions behind each step. In Wikidoc, every AI flowchart is a process map, so you can add owners, durations and linked documents when you need them. Most processes need a map and SOPs: the map shows the whole journey, and each step links to the SOP for it.
In a small business, processes usually live in people’s heads, and that works until it doesn’t. Documenting them, starting with a simple flowchart, pays off in several ways:
Traditional tools like Visio or Lucidchart give you a blank canvas: you decide every shape, drag every arrow and line them up by hand. An AI flowchart generator starts from words instead. You describe the process, or upload a document or recording of someone explaining it, and the AI identifies the roles, steps and decisions and lays them out for you. You spend your time checking that the process is right, not formatting boxes. See SOP vs work instruction vs process map for when to use which.
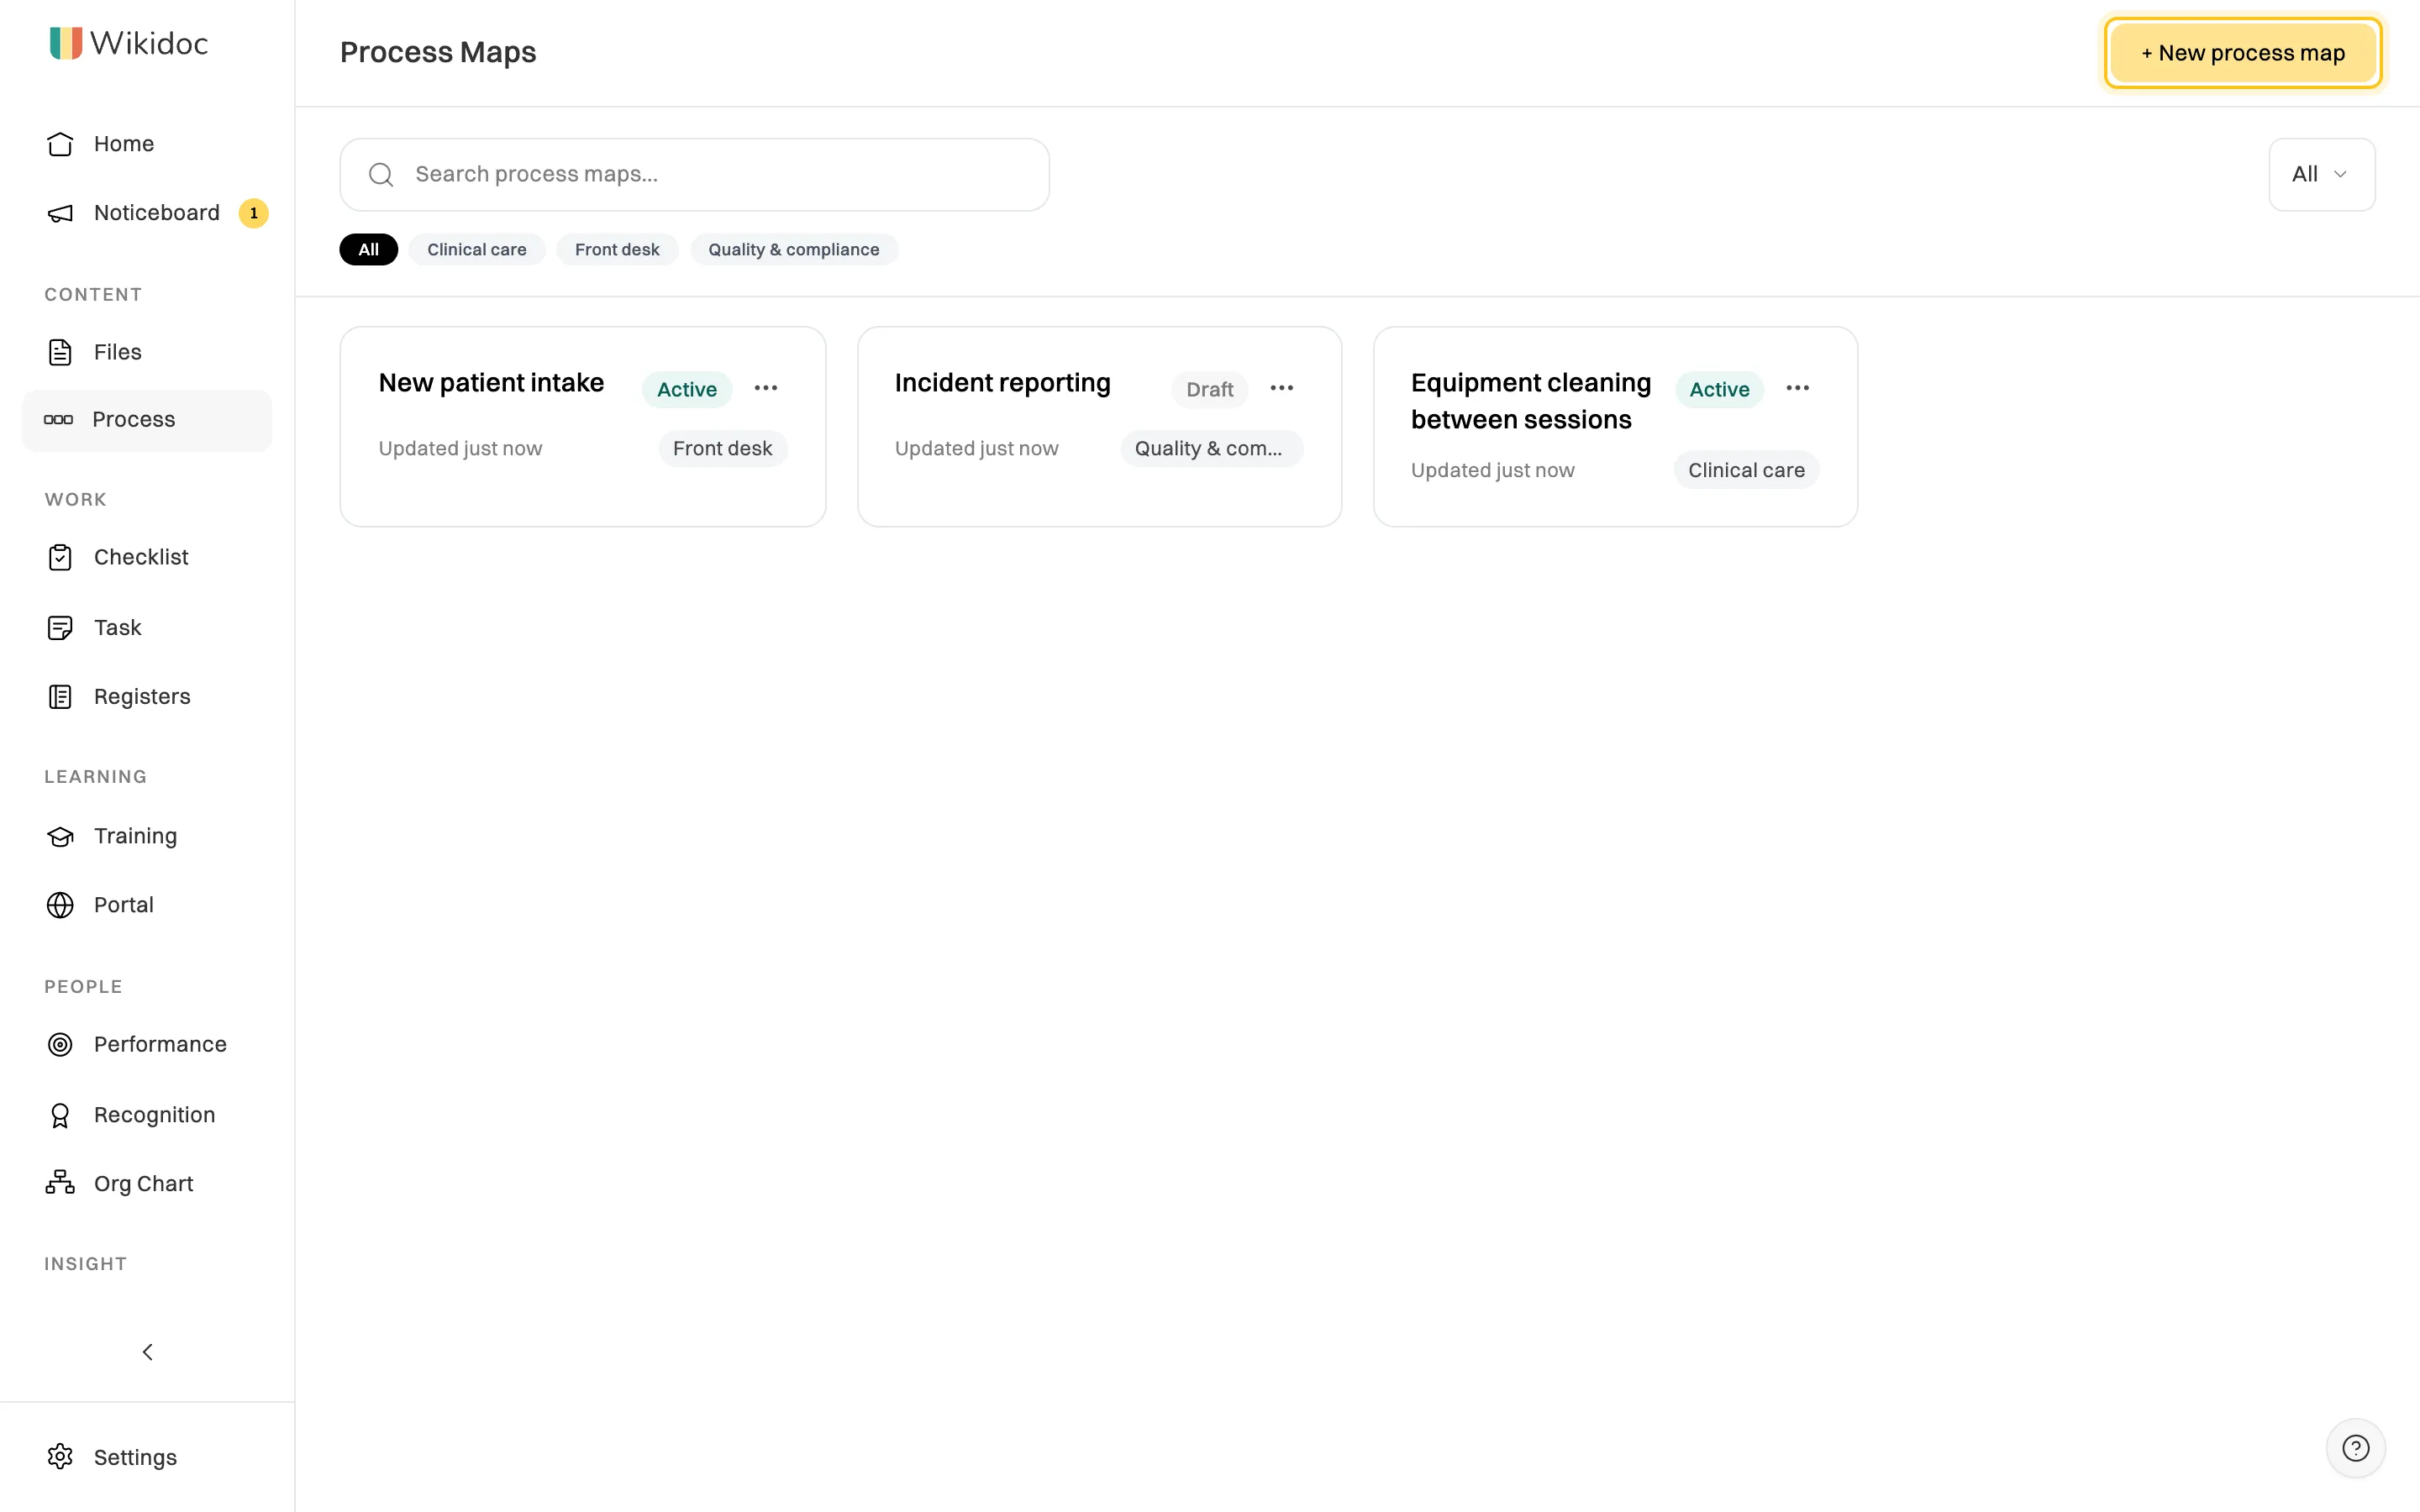
Click Process in the sidebar, then + New process map. A blank map called Untitled Process Map opens. You don’t need to name it: Wikidoc names it after the process when it draws it.
In the Sources panel, give Wikidoc something to work from:
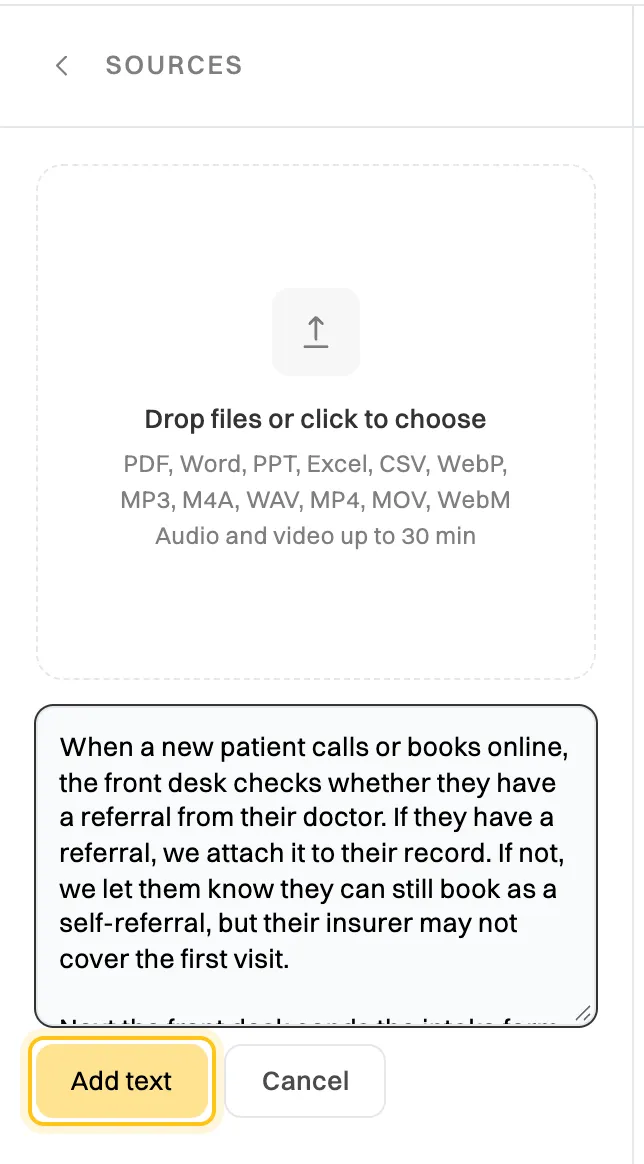
The quality of the flowchart depends on the description. Four rules make the difference:
Here’s an example that maps well:
A patient calls or books online. The front desk checks whether they have a referral. If they do, the front desk attaches it to the patient’s record; if not, they ask the patient to bring one. The front desk then sends the intake form. The physical therapist reviews the form before the first appointment and confirms the treatment plan with the patient.
Click Generate. In under a minute, Wikidoc draws the map: each role gets its own lane, each decision becomes a diamond, and every branch is labelled with its answer. Steps are numbered in the order they happen.
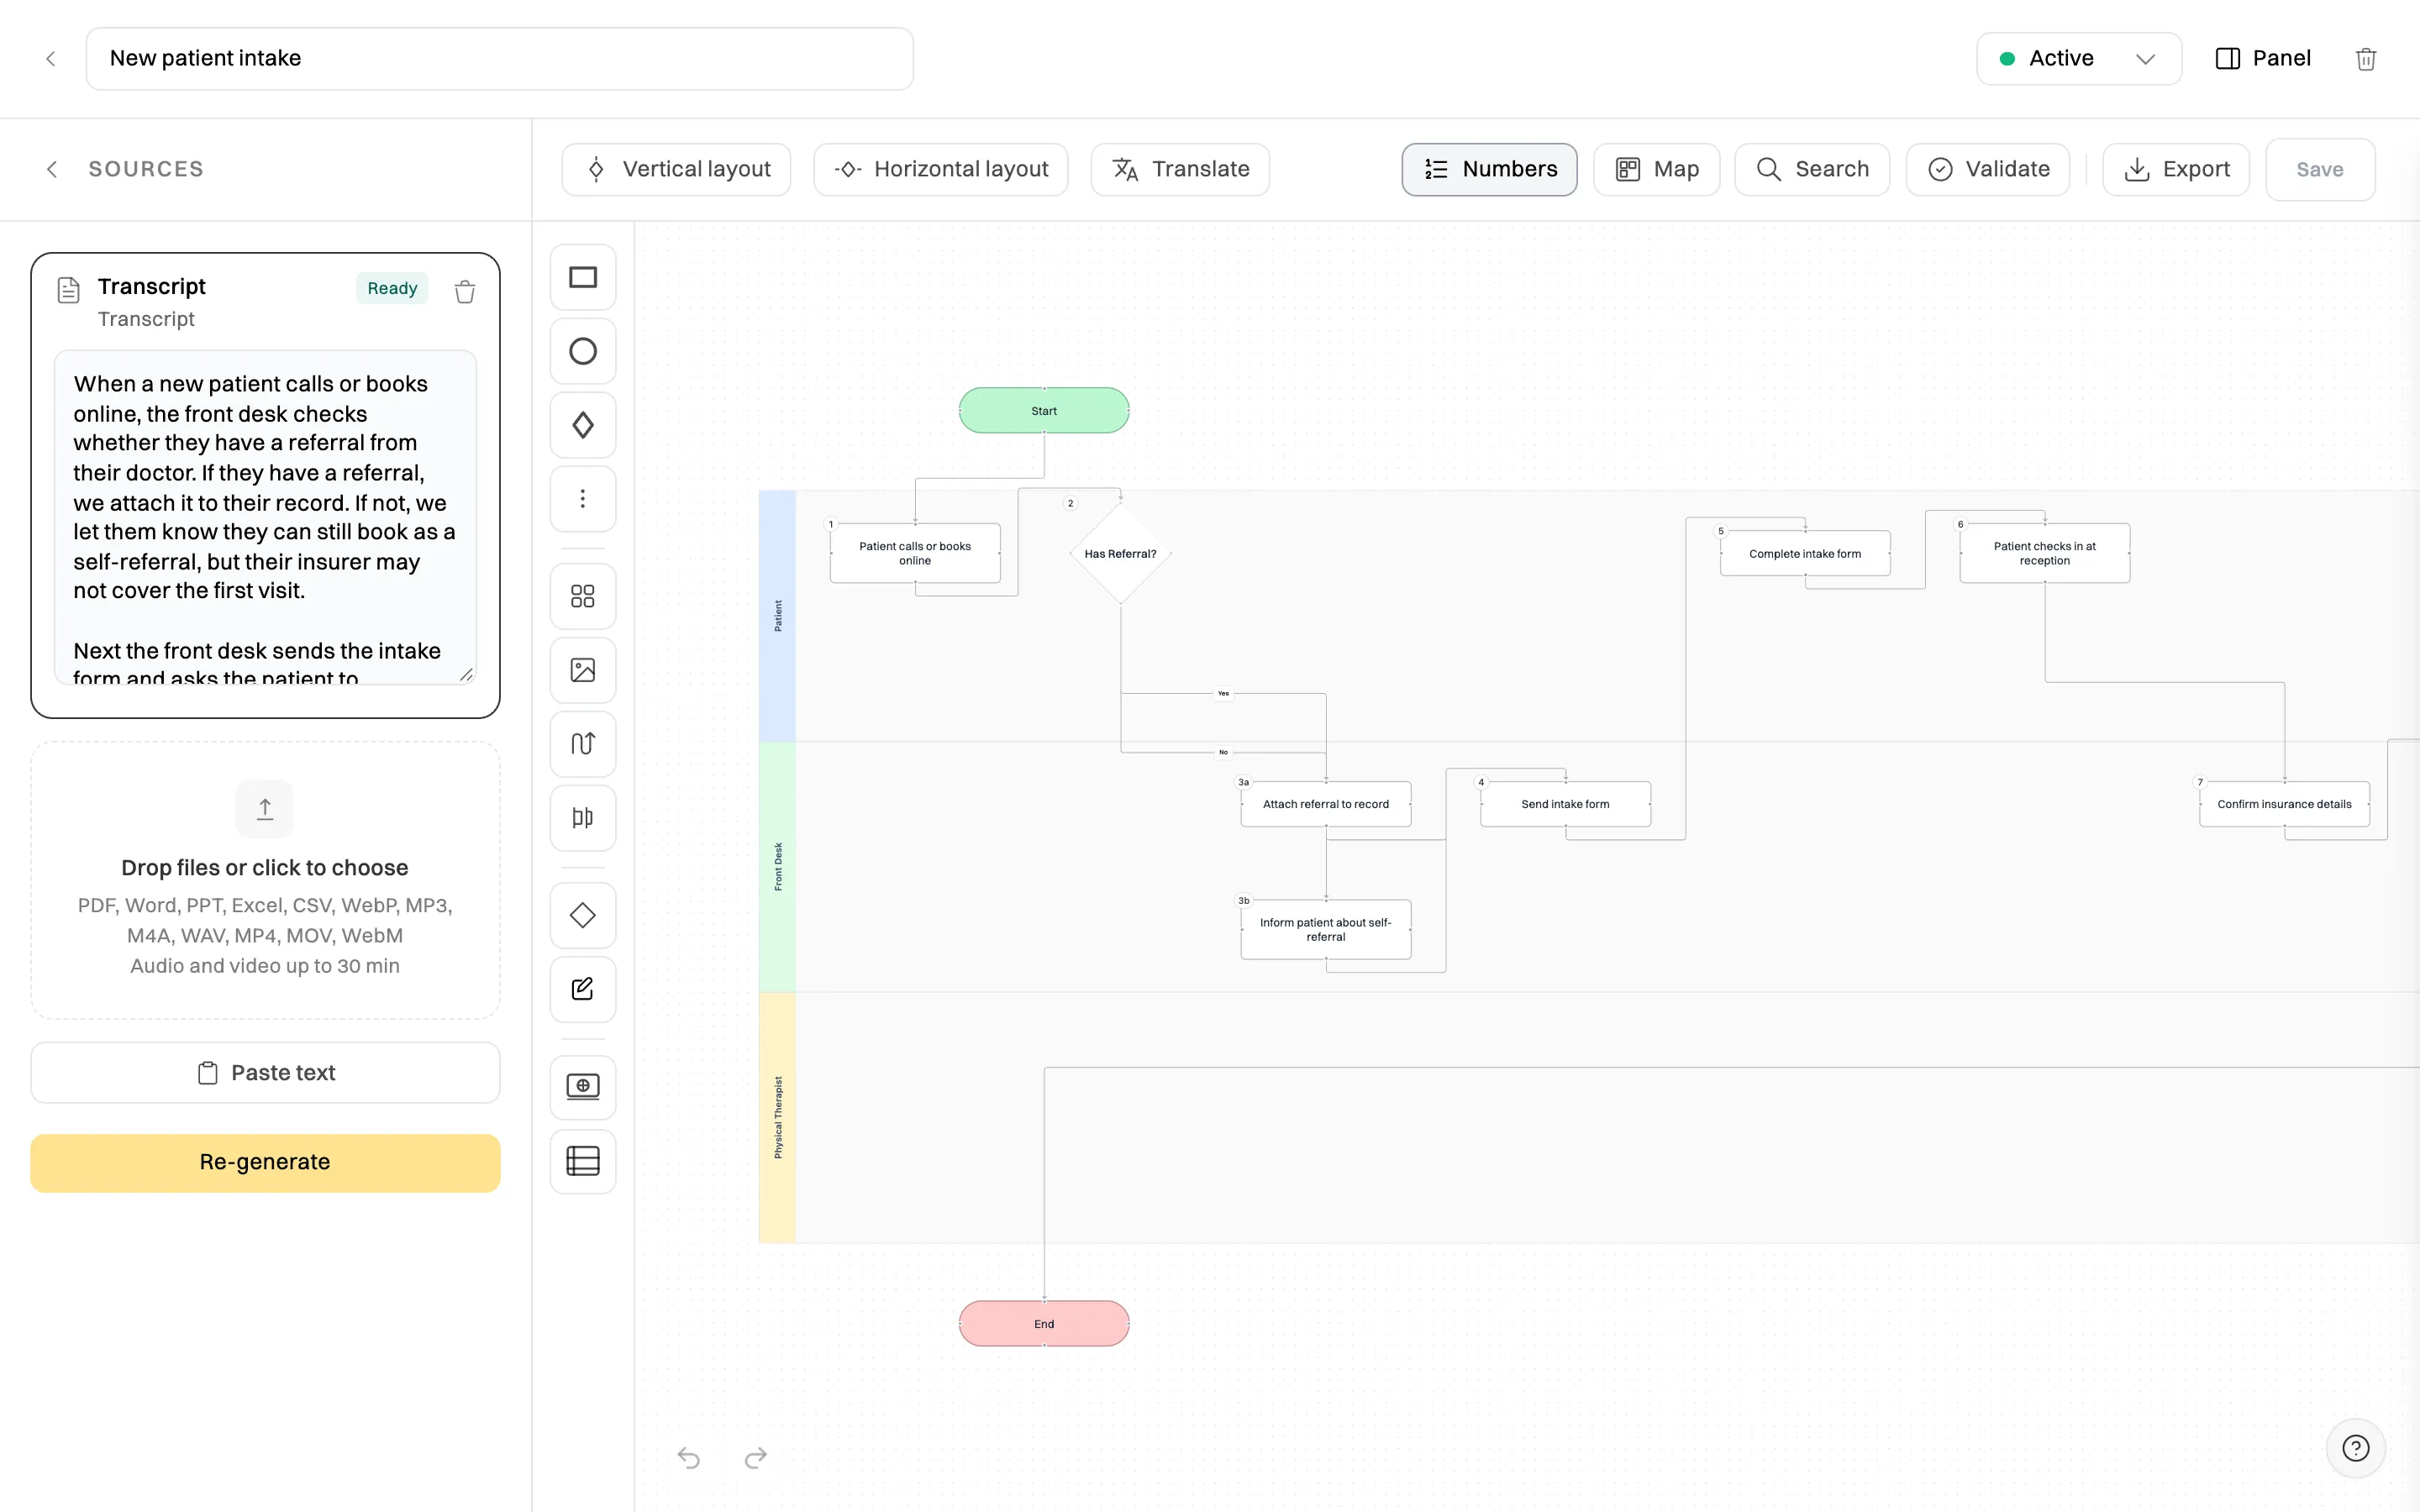
The map is saved as a Draft. If it’s not right, edit your description and click Re-generate. Wikidoc lists what will be replaced, and saves the current map as a version first.
Click any step to open its toolbar. You can change the shape, text and colour, add a badge such as Approval or Critical, and record:
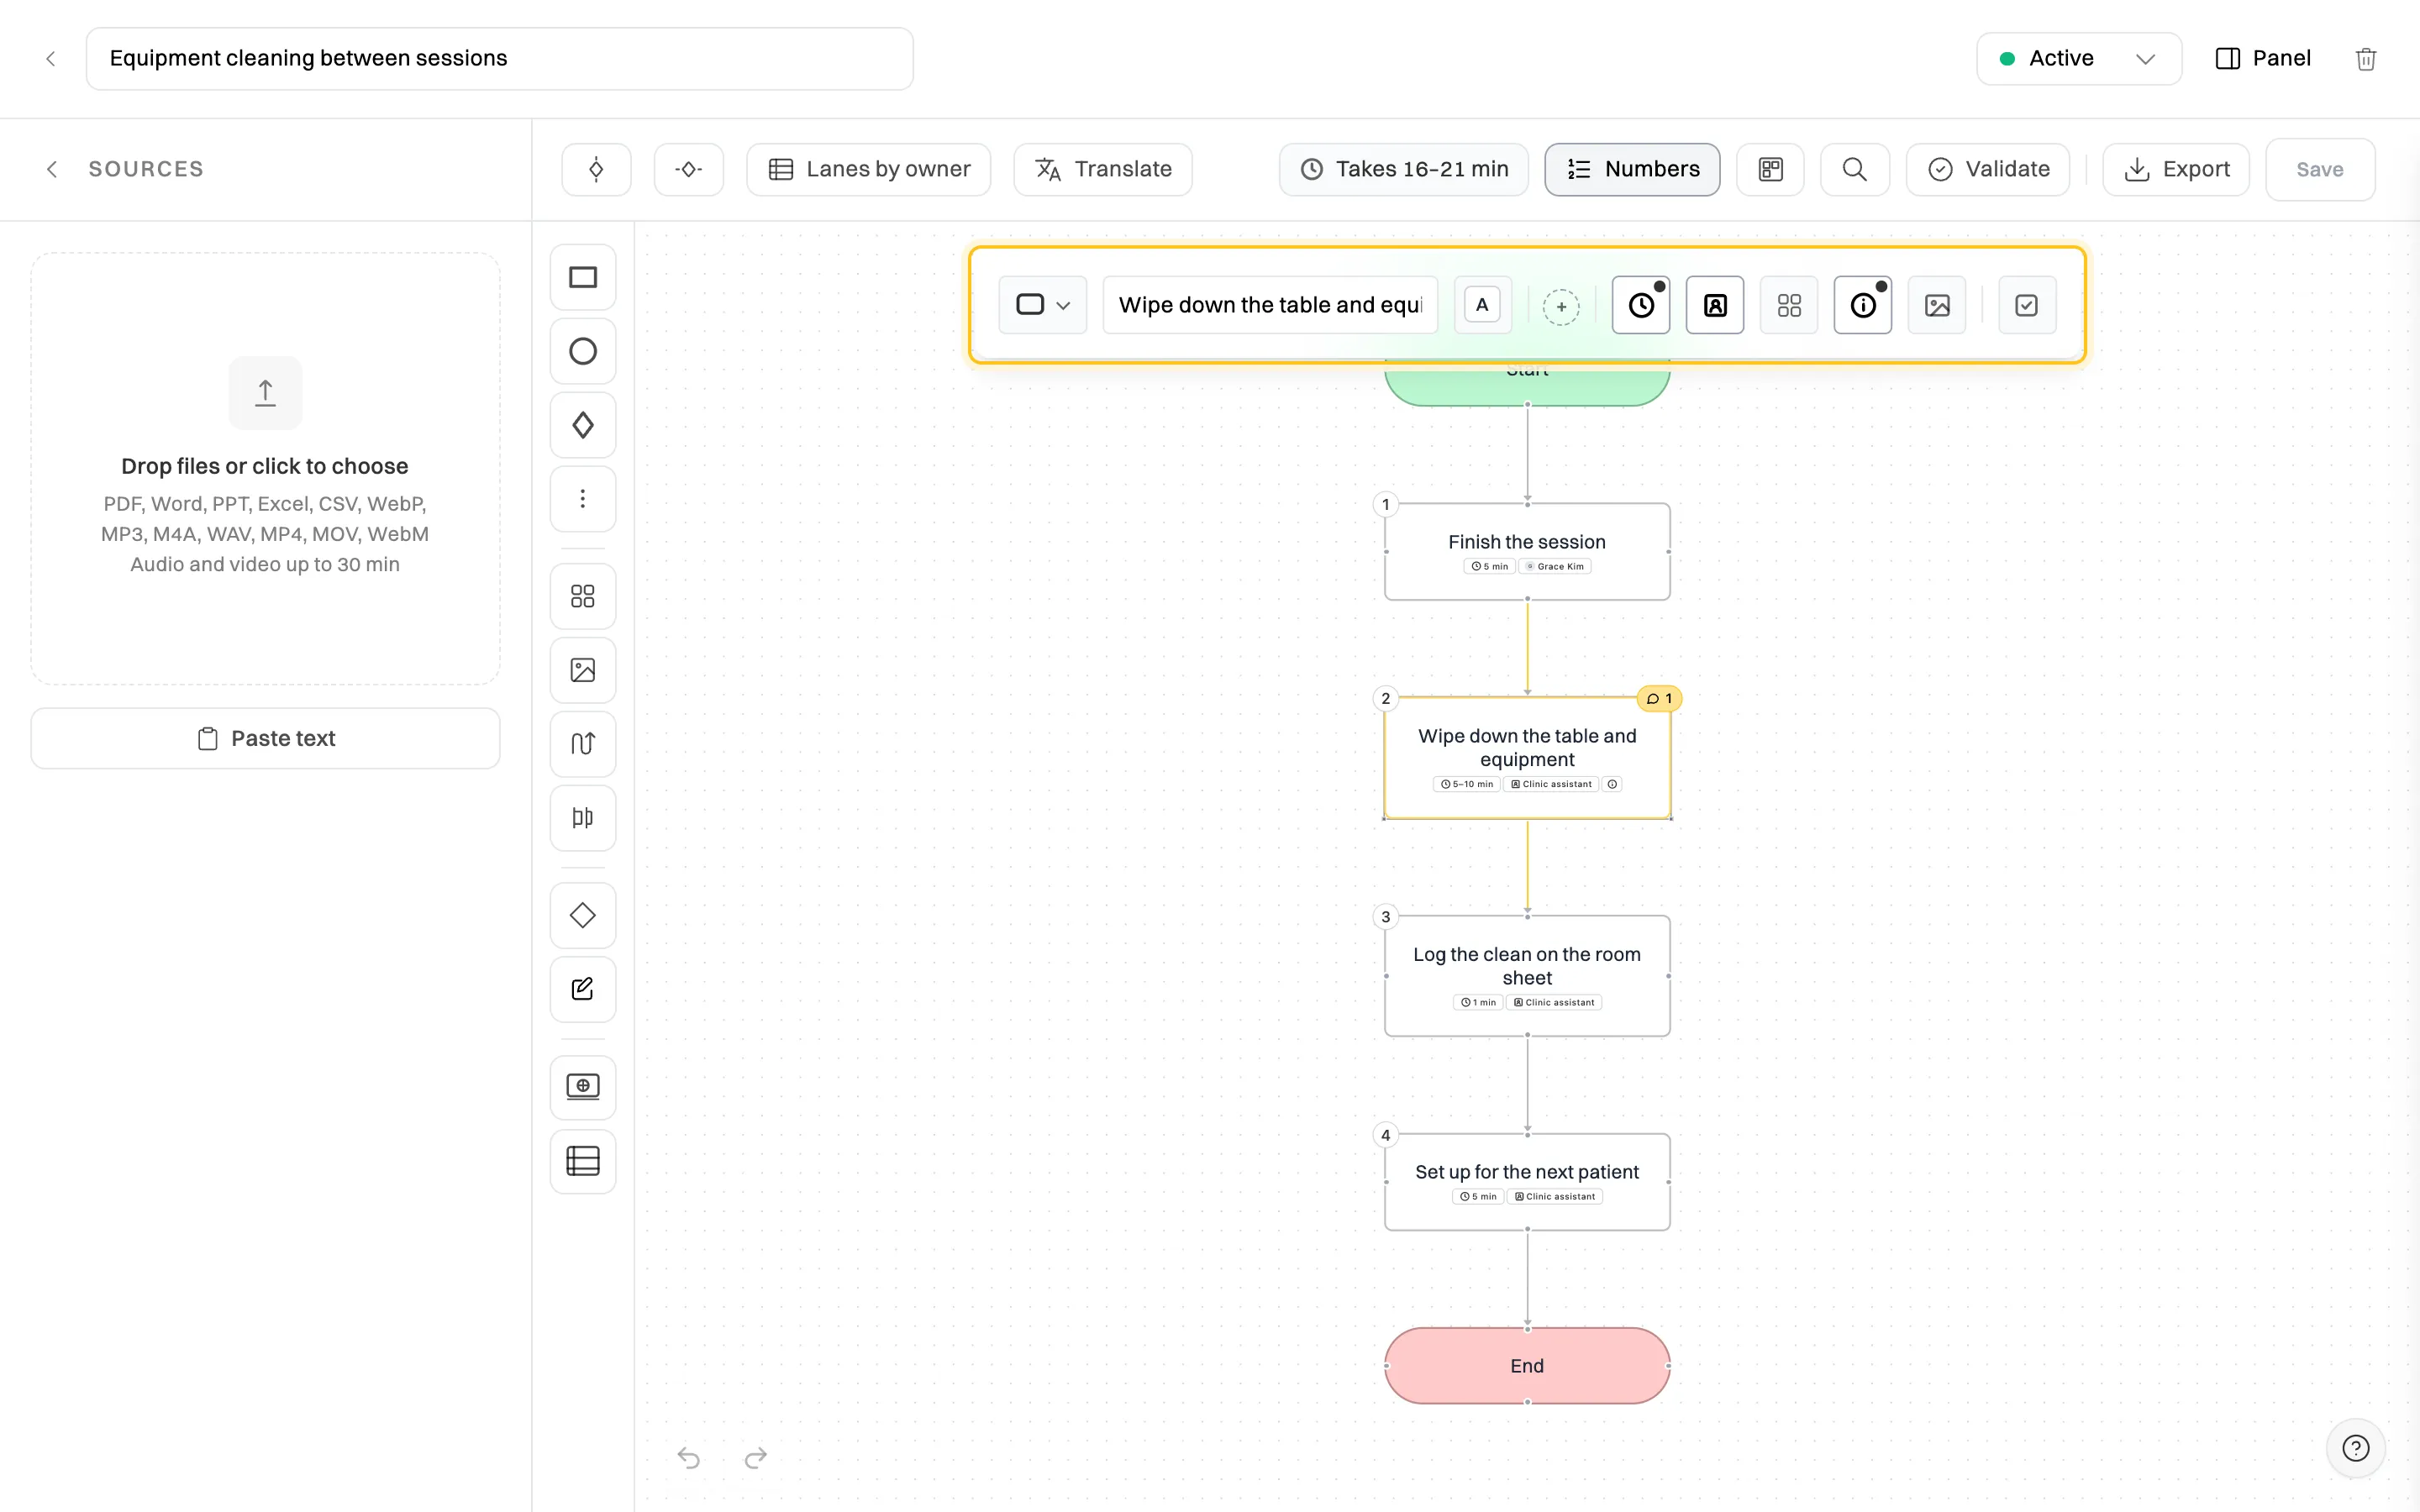
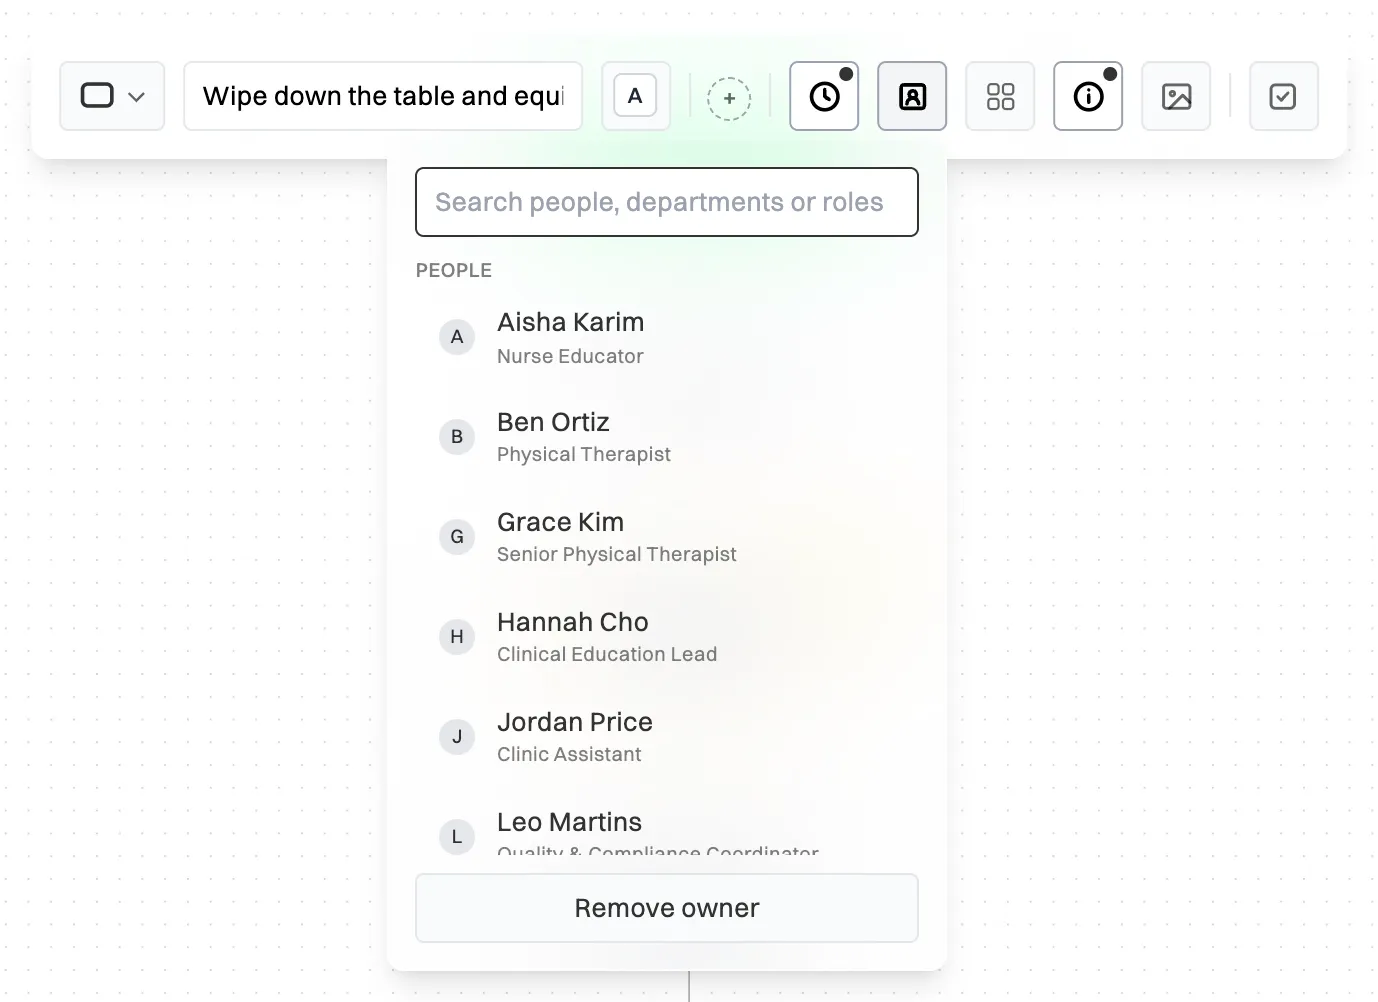
Drag new shapes from the toolbar on the left, and drag from the dot on a step’s edge to connect it to another. For processes that split and rejoin, use the XOR, AND, OR and MERGE gateways. Attach the SOPs, checklists and training that go with each step so people find them in context.
Click Validate. Wikidoc lists anything that’s broken: steps with no connections, decisions with only one way out, steps that can’t be reached from Start, a missing End, or a step owned by someone who has left. Click Go → to jump to each one.
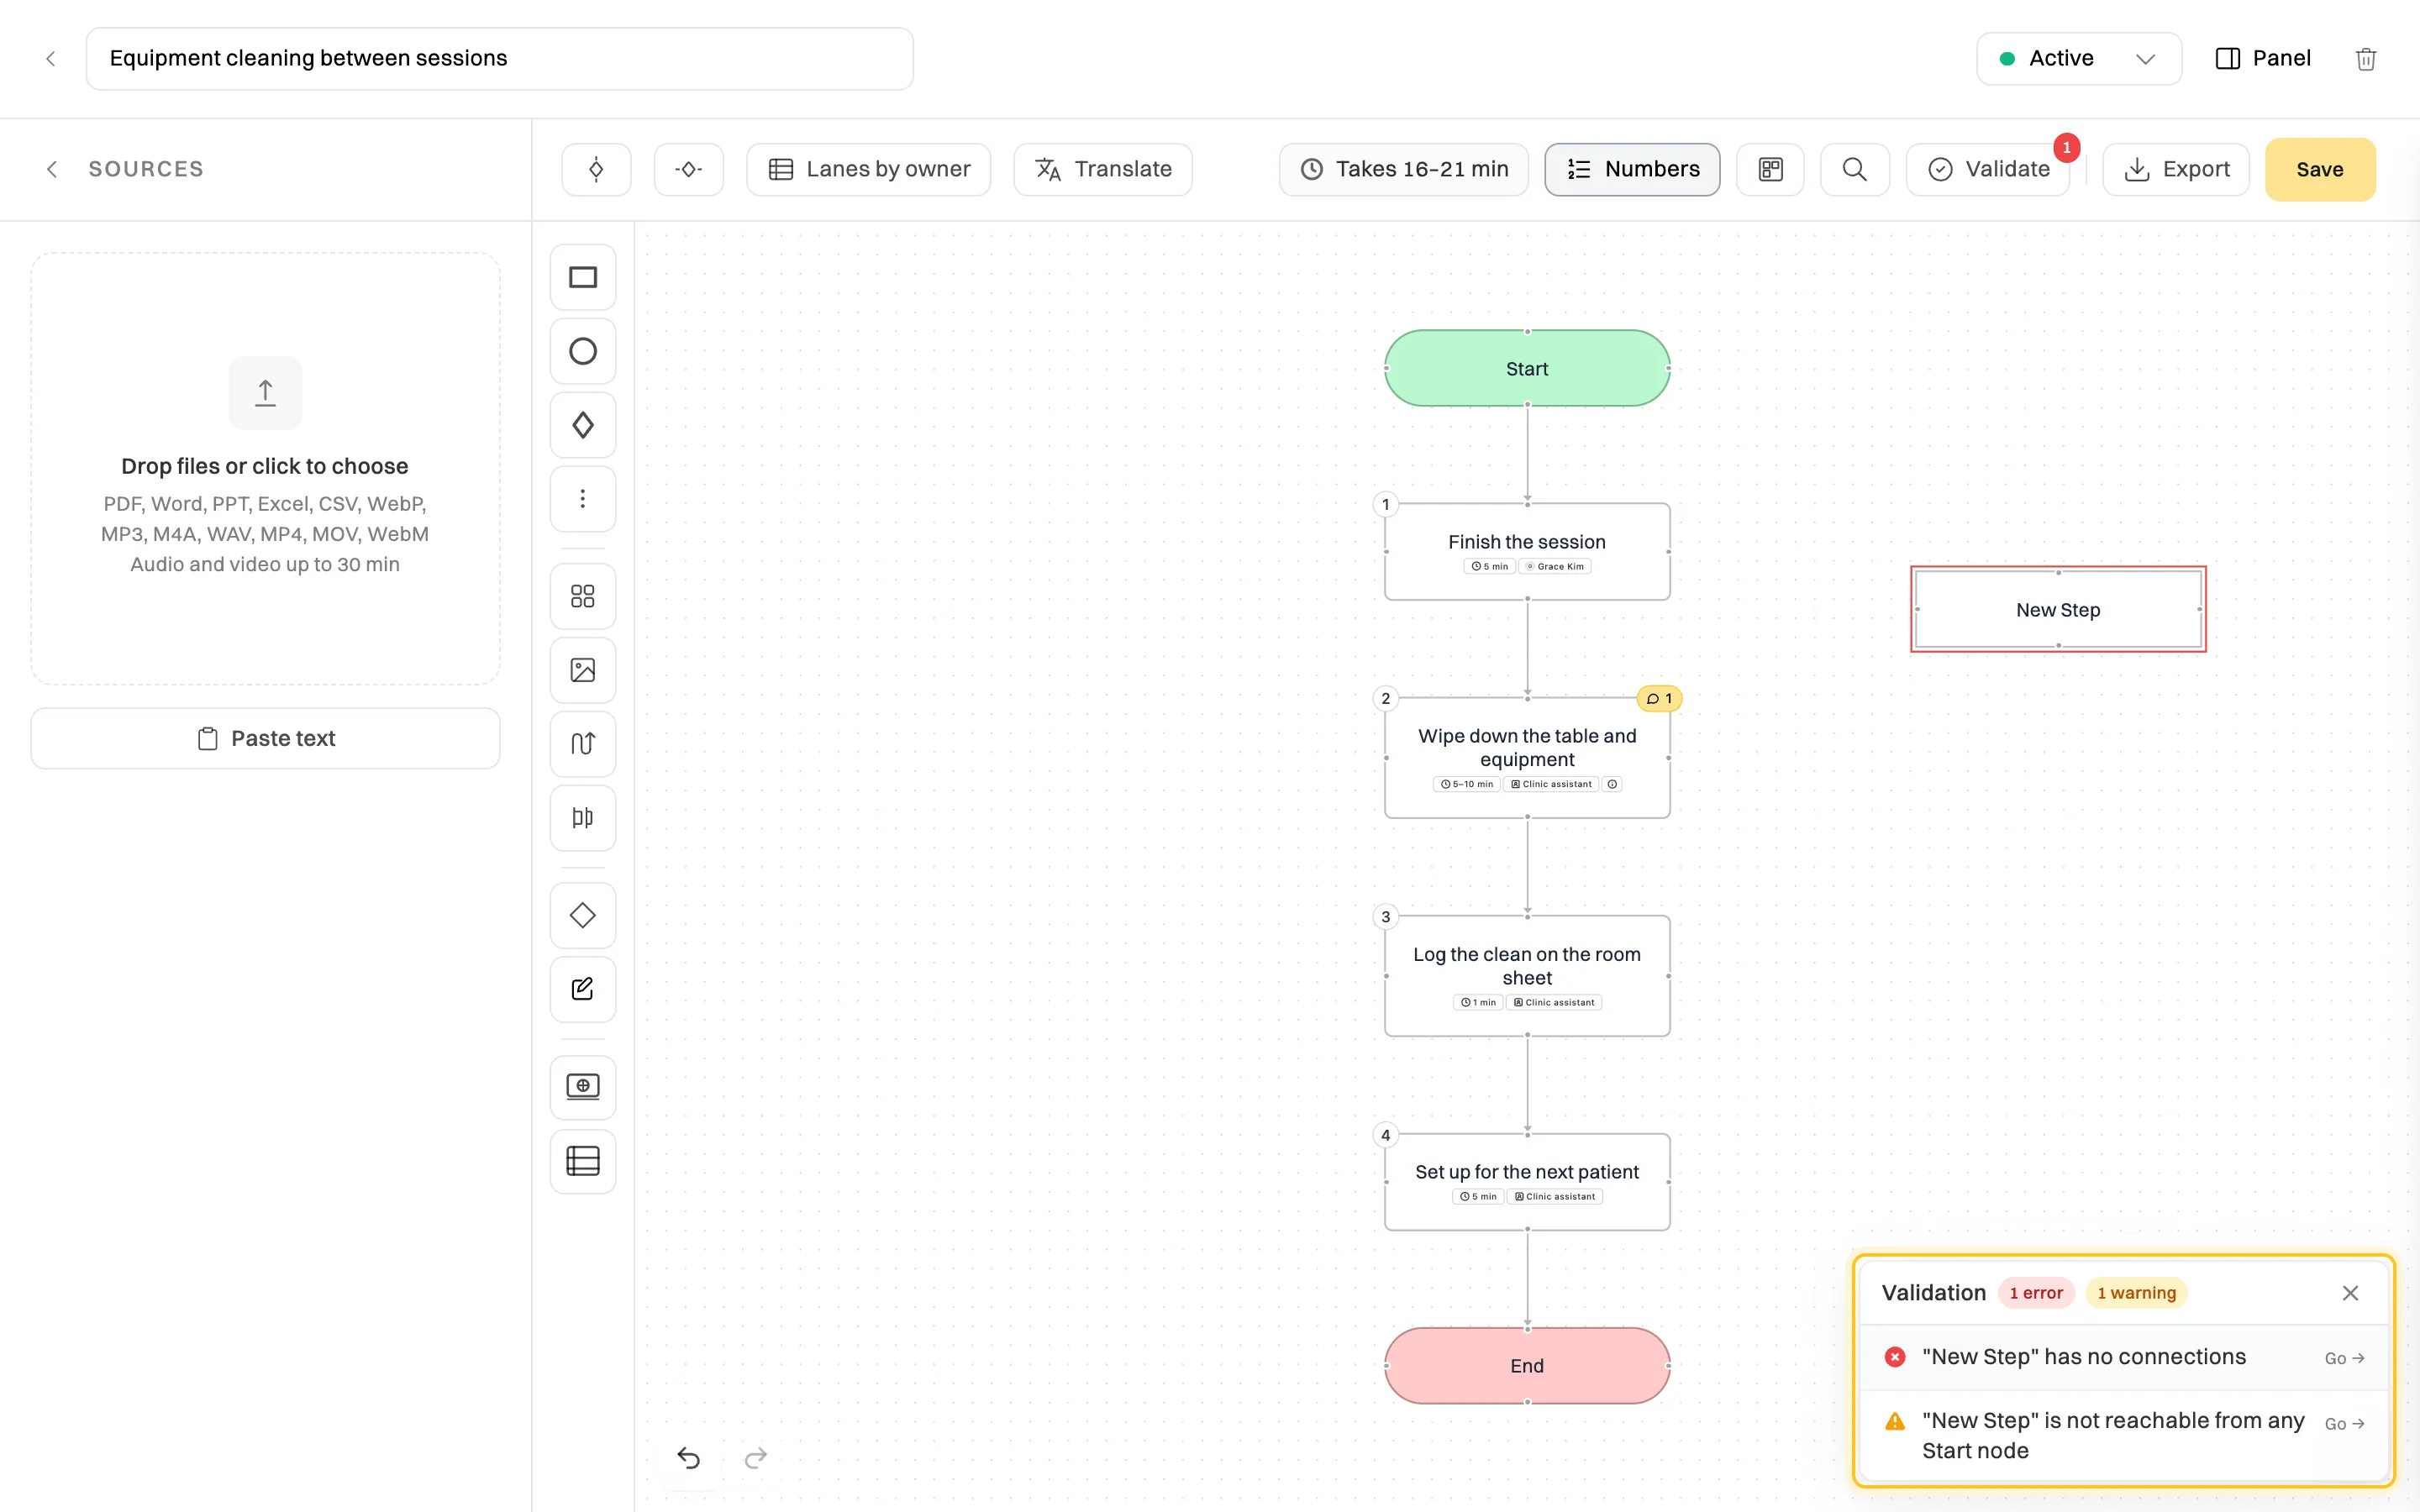
When it’s clean, click Save and change the map’s status from Draft to Active.
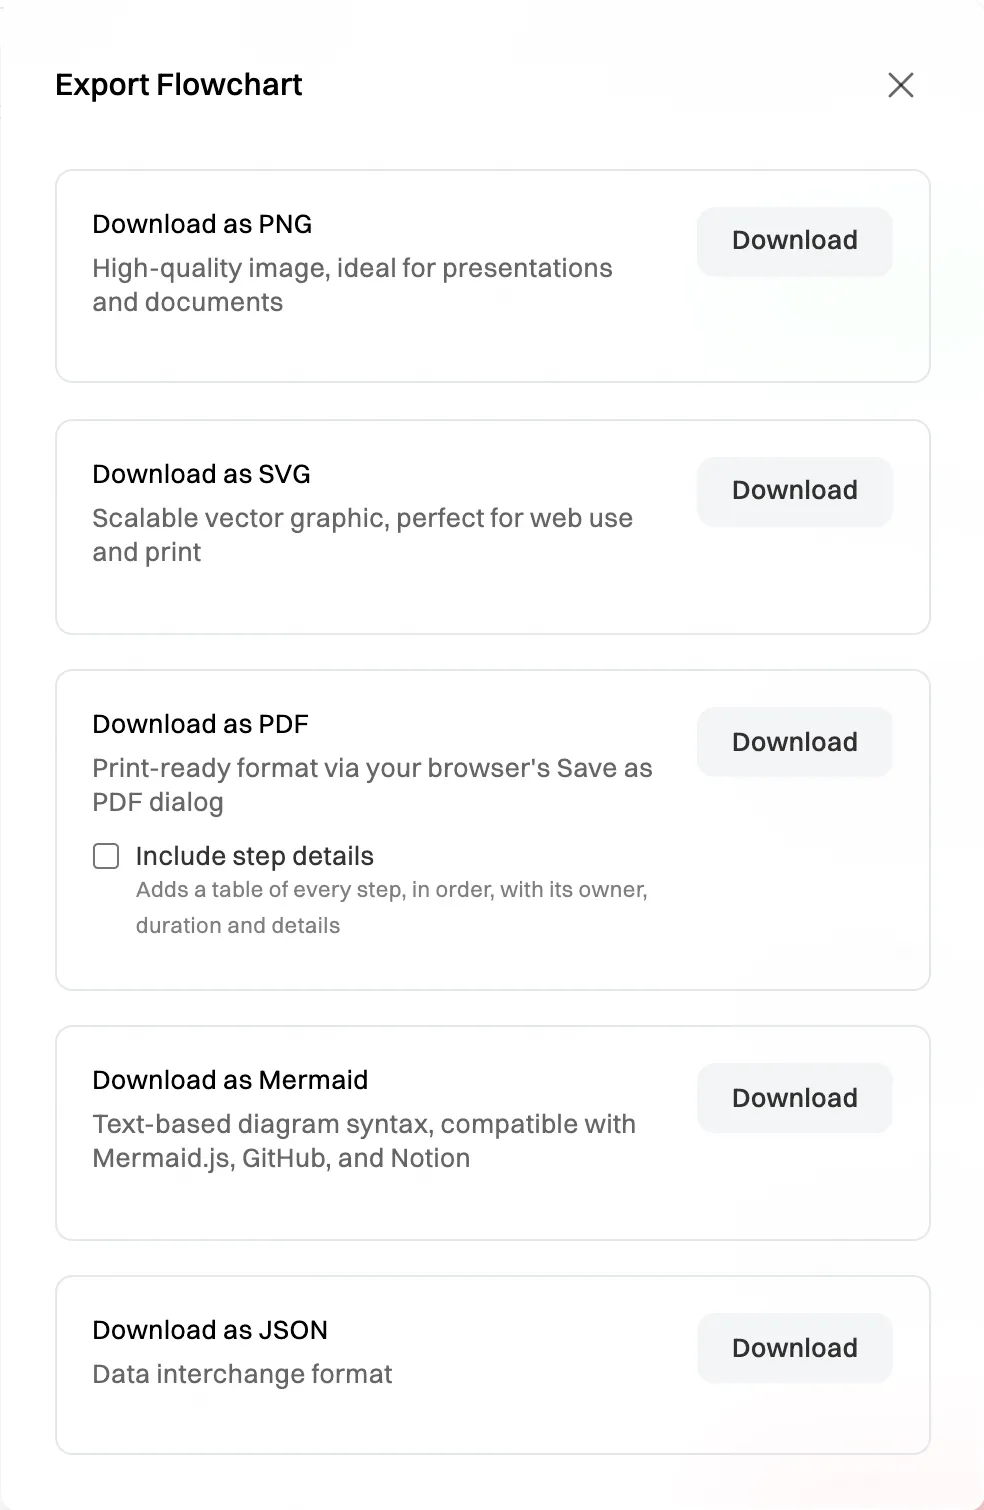
Everyone in your organisation can open an active map in Wikidoc. To use it elsewhere, click Export:
| Format | Use it for |
|---|---|
| PNG | Slides and documents |
| SVG | Web pages and large prints |
| Printing. Tick Include step details to add a table of every step with its owner, time and instructions | |
| Mermaid | Notion, GitHub and Markdown pages |
| JSON | Importing into Lucidchart |
Want to try it before signing up? Use the free AI flowchart generator, or see everything process maps can do on the flowchart feature page. For the written instructions behind each step, see How to Create SOPs with AI.
Yes. Paste or type a description of the process, saying who does each step and what happens at each decision, and Wikidoc draws the flowchart with swimlanes and labelled branches in under a minute.
Yes. Upload a written procedure (PDF, Word, PowerPoint, Excel or CSV) or an audio or video recording of someone explaining the process. Wikidoc reads or transcribes it, then draws the map. Where a document and a recording disagree, the map follows the document.
A flowchart shows the sequence of steps and decisions. A process map adds who does each step (swimlanes and owners), how long it takes, and the documents and tools behind it. Every Wikidoc flowchart can carry that detail.
Yes, every part of it: steps, lines, decisions, gateways, swimlanes and notes. You can also draw a flowchart from scratch without AI.
Export a PNG or SVG for PowerPoint and documents, a PDF for printing, Mermaid for Notion and GitHub, or JSON in Lucidchart’s import format.
Yes. The Free plan includes three process maps, and export works on every plan. Pro and Team have unlimited maps, more sources per map and version history.


